

Humidity and Temperature Transmitter Series HMW90
±1.7%RH wall transmitters with a certificate for demanding HVAC
Application note
The self-heating of electronics in carbon dioxide (CO2) instruments usually originates from two main sources: the power required to take the CO2 measurement (sensor infrared source) and the energy required to generate the output signals.
Incandescent light bulbs – typical infrared sources in CO2 sensors – consume a significant amount of power and thus generate heat. The heat spreads within the instrument enclosure. Because the enclosure limits thermal exchange with the surrounding environment, the temperature within the instrument is always slightly higher than the ambient temperature.
Self-heating is practically irrelevant for sensors that only measure CO2. However, when the instrument also measures temperature, self-heating disturbs the measurement by inducing a temperature measurement error, which is typically around 1°C (1.8°F), or even more.
Just like temperature, relative humidity can’t be reliably measured in close proximity to a heat source. Relative humidity is a temperature-dependent parameter, so the accuracy of measurement results will be affected by self-heating.
Figure 1 shows how +1°C (1.8°F) and +2°C (3.6°F) temperature errors distort relative humidity readings at room temperature (20°C, 68°F). The horizontal axis shows the humidity level in the environment and the vertical axis the error in relative humidity (%RH) measurement.
The humidity measurement error rate grows as a function of increasing relative humidity. Increased self-heating also results in a greater error. At 50%RH and 20°C ambient temperature, the error is -3%RH for instruments with +1°C (1.8°F) self-heating and -6%RH for instruments with +2°C (3.6°F) self-heating.
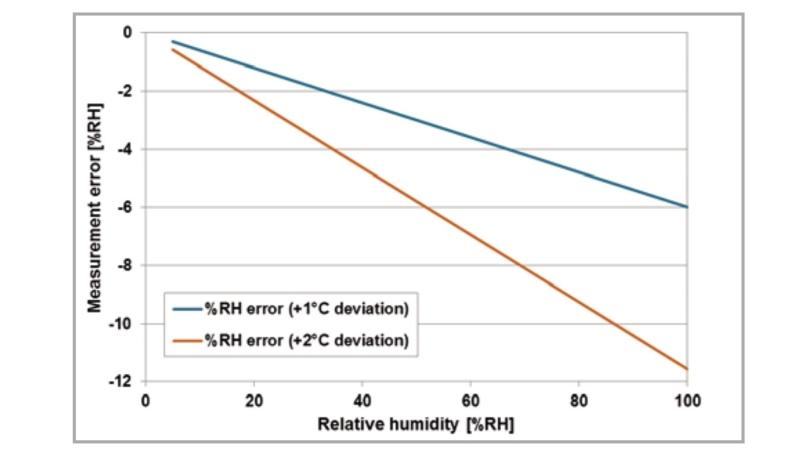
Figure 1: Error in relative humidity reading resulting from +1°C (1.8°F) and +2°C (3.6°F) self-heating at room temperature (20°C, 68°F).
Sensor manufacturers may consider automatic compensation to correct the negative effect of self-heating on temperature measurement. In theory, this can be done by subtracting an average correction factor from the measurement results.
Compensation may work in some conditions; however, the amount of self-heating is not constant in all conditions. Instead, it is dependent on airflow and the wall material behind the sensor. Moreover, applying a correction factor larger than the specified measurement accuracy is highly questionable.
Also, compensation of humidity measurements is even more difficult than that of temperature. In conclusion, compensating for self-heating is not recommended.
It is simple and straightforward to perform self-heating tests, even without investing in expensive equipment:
Figure 2 shows an example of the expected self-heating test behavior. The relative humidity reading decreases as the temperature increases due to self-heating.
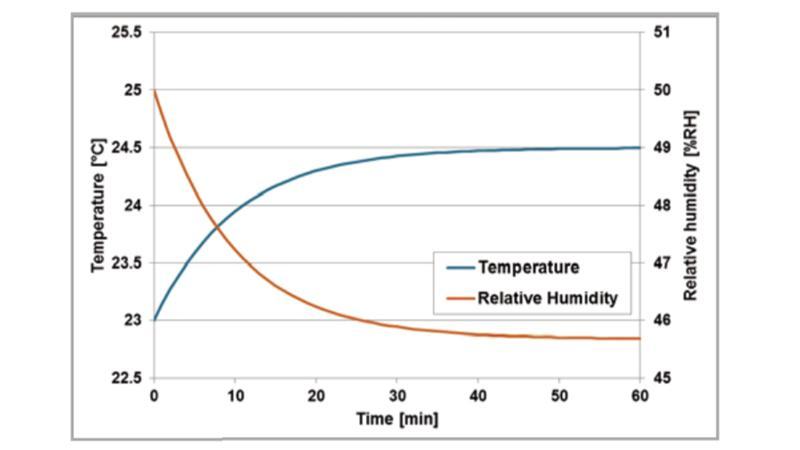
Figure 2: Example of a self-heating test. The transmitter is allowed to reach equilibrium with the surrounding environment.
Vaisala GMW90 Series Carbon Dioxide, Temperature, and Humidity Transmitters were tested for the tendency to self-heat. The results were compared with two competitors’ instruments (Devices 1 and 2, marked as Sp2 and Sp3). Vaisala’s GMW90 transmitter was marked as Device 3 (Sp4).
Figure 3 shows the thermal images of the tested transmitters before power-up. All transmitter temperatures (Sp2, Sp3, and Sp4) are in equilibrium with the background wall temperature (Sp1).
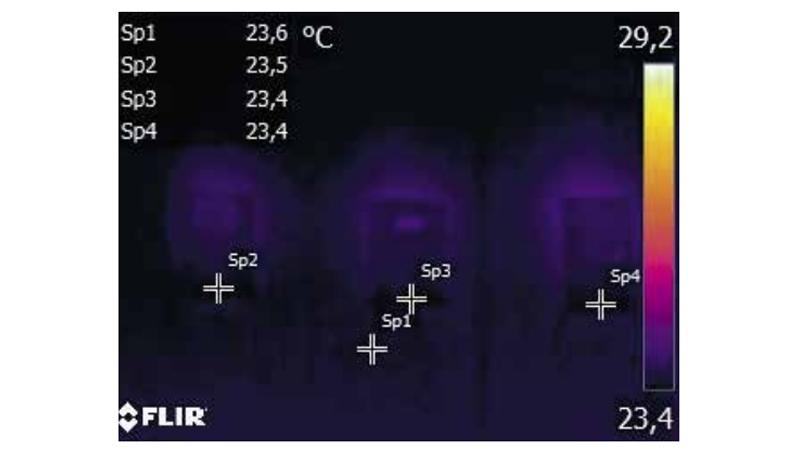
Figure 3: Transmitter temperatures before power-up
Figure 4 shows the thermal images of the transmitters 30 minutes after power-up. The temperature readings were taken from the estimated location of the temperature sensor within the instruments. Clear differences between the transmitter temperatures can be observed.
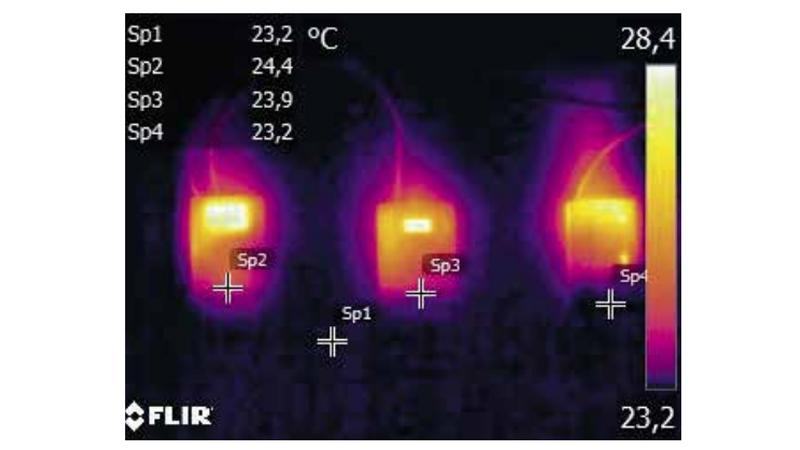
Figure 4: Transmitter temperatures 30 minutes after power-up
The test results are collected in Table 1. To conclude, there are significant differences in the self-heating tendency of the three transmitters. The highest self-heating device (Device 1) was 1.3°C (2.34°F) and the lowest (Device 3) was only 0.2°C (0.36°F).
The Vaisala GMW90 transmitter outperforms the competition due to its unique low-power microglow infrared source. Its power consumption is only 25% that of traditional infrared sources.
| Temperature unpowered, °C (°F) | Deviation from background temperature, °C (°F) | Temperature 30 min. after power-up, °C (°F) | Difference to background temperature, °C (°F) | Self-heating, °C (°F) | |
| Background temperature (Sp1) | 23.6 (74.5) | 23.2 (73.8) | |||
| Device 1 (Sp2) | 23.5 (74.3) | -0.1 (-0.2) | 24.4 (75.9) | 1.2 (2.2) | 1.3 (2.3) |
| Device 2 (Sp3) | 23.4 (74.1) | -0.2 (-0.4) | 23.9 (75.0) | 0.7 (1.3) | 0.9 (1.6) |
| Device 3 (Sp4)* | 23.4 (74.1) | -0.2 (-0.4) | 23.2 (73.8) | 0 (0) | 0.2 (0.4) |
Table 1: Self-heating test results.
* Vaisala GMW90 transmitter
±1.7%RH wall transmitters with a certificate for demanding HVAC
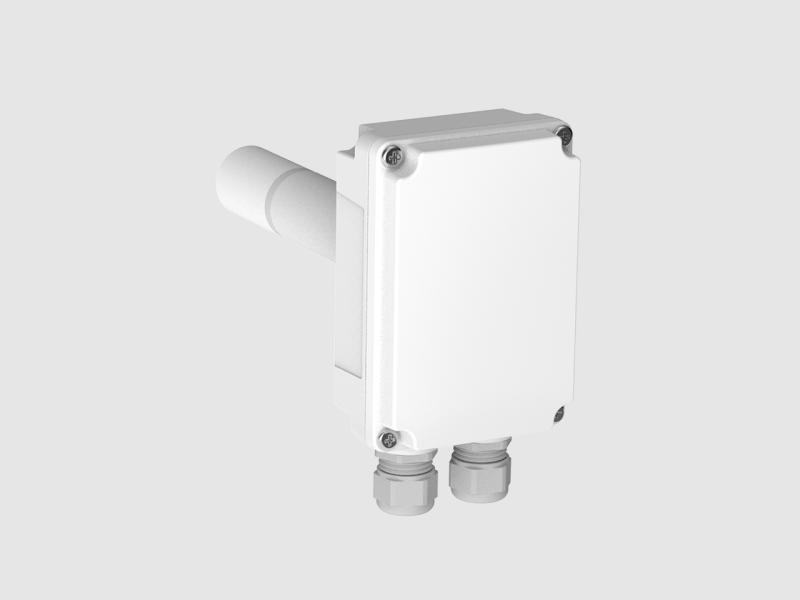
For high-accuracy measurements in HVAC applications
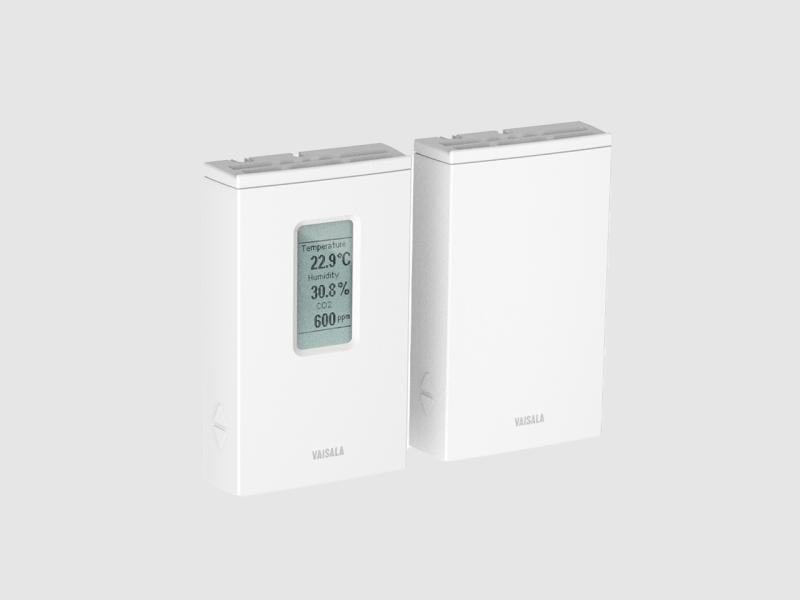
for green building projects
for green building projects
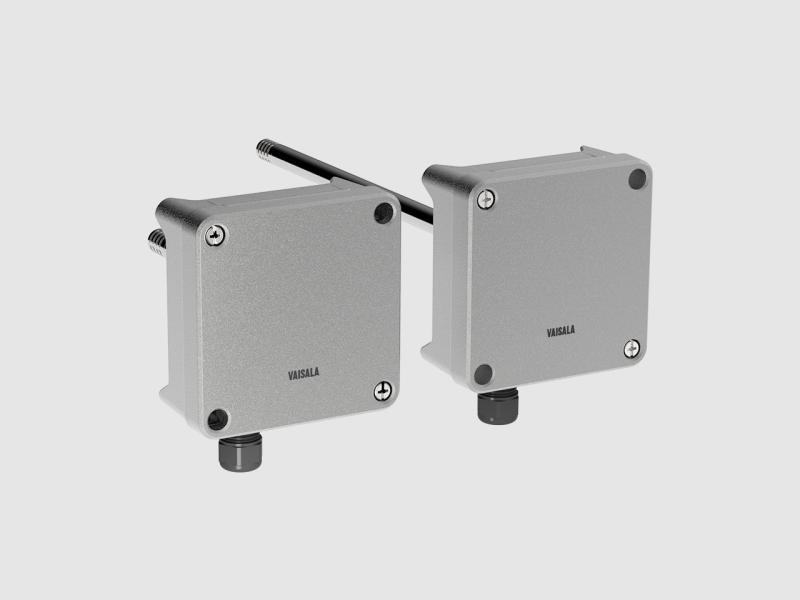
For high precision measurements in demanding HVAC applications
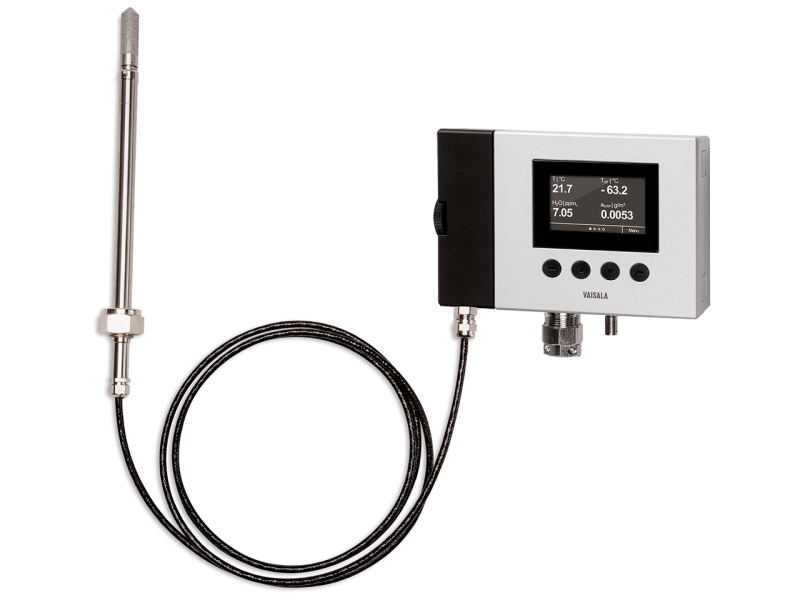
For use up to zone 0 and 20

How infrared sensors work, temperature/pressure/humidity compensation, and transmitter placement.
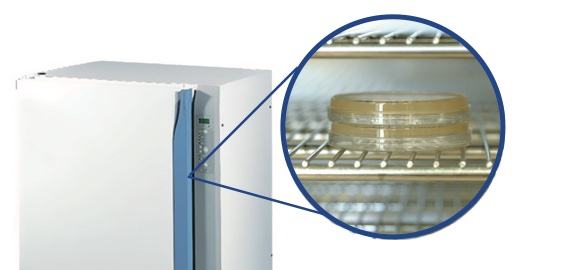
Why CO2 is critical in cell culture, the risk of condensation when measuring in high humidity and temperature, and why sterilization without removing…

Why O2 is lowered and CO2 raised in controlled-atmosphere rooms, and which instruments withstand the cold and high humidity of this environment.

What equilibrium sampling is, why sensor heating can skew field measurements, and what range is needed for deep soil profiles.
A specialist replies with the solution, the instrument and the service that fit.
Instruments to quote
No instruments yet. An enquiry can be sent anyway: a specialist answers.