

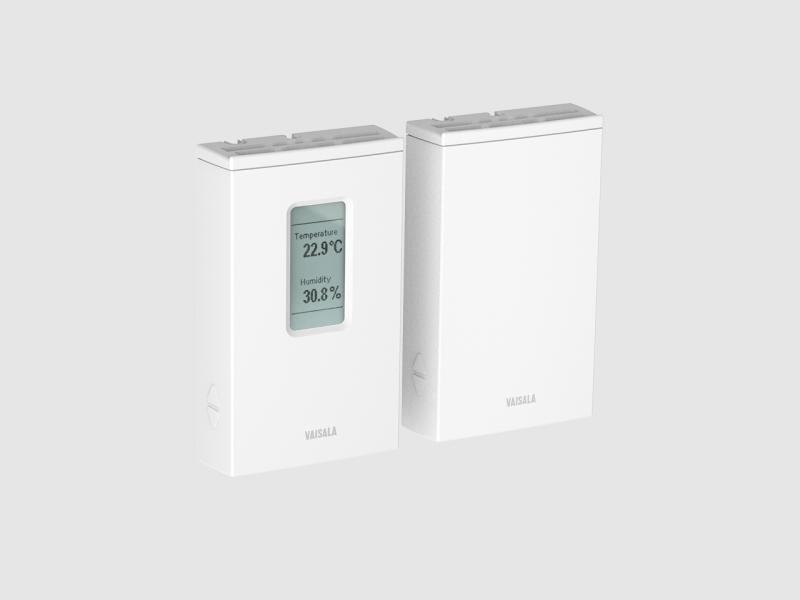
Humidity and Temperature Transmitter Series HMW90
±1.7%RH wall transmitters with a certificate for demanding HVAC
Application note
Carbon dioxide and other gases consisting of two or more dissimilar atoms absorb infrared (IR) radiation in a characteristic, unique manner. Such gases are detectable using IR techniques. Water vapor, methane, carbon dioxide, and carbon monoxide are examples of gases that can be measured with an IR sensor. Their characteristic absorption bands are shown in Figure 1.
IR sensing is the most widely applied technology for CO2 detection. IR sensors have many benefits over chemical sensors. They are stable and highly selective to the measured gas. They have a long lifetime and, as the measured gas doesn't directly interact with the sensor, IR sensors can withstand high humidity, dust, dirt, and other harsh conditions.
The key components of an IR CO2 detector are light source, measurement chamber, interference filter, and IR detector. IR radiation is directed from the light source through the measured gas to the detector. A filter located in front of the detector prevents wavelengths other than that specific to the measured gas from passing through to the detector. The light intensity is detected and converted into a gas concentration value.
The Vaisala CARBOCAP® carbon dioxide sensor uses IR sensing technology to measure the volumetric concentration of CO2. It features a unique electrically tunable Fabry-Perot Interferometer (FPI) filter for dual-wavelength measurement. This means that in addition to measuring CO2 absorption, the CARBOCAP® sensor also performs a reference measurement, which compensates for any changes in the light source intensity as well as for dirt accumulation and contamination. This makes the sensor extremely stable over time. View the complete range of Vaisala products for CO2 measurement at www.vaisala.com/CO2
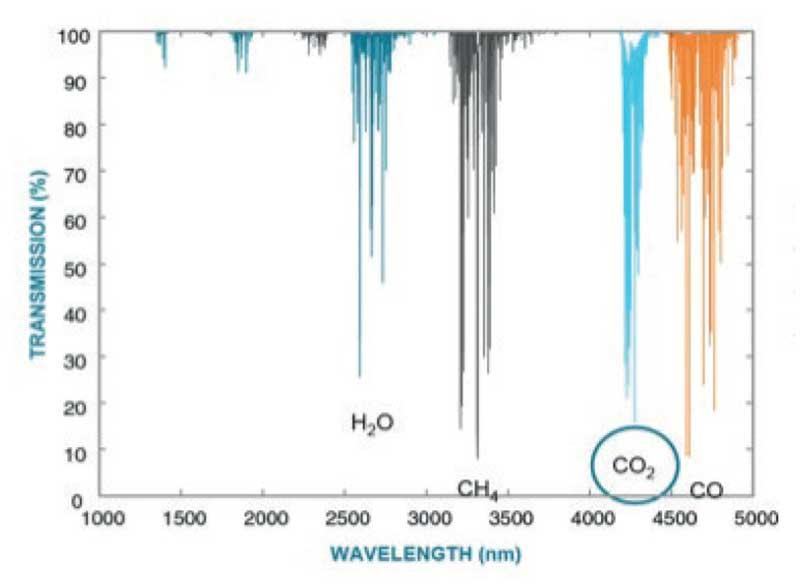
Figure 1. IR absorption of CO2 and some other gases.
The ideal gas law is useful when estimating the effect of temperature and pressure changes on CO2 measurement. It can be used to compensate the CO2 readings.
Ideal gas is a hypothetical gas consisting of randomly moving identical point particles that are negligible in size and possess negligible intermolecular forces. Ideal gas molecules are assumed to undergo elastic collisions both with each other and with the container walls.
In reality, gases do not behave exactly like ideal gases, but the approximation is often used to describe the behavior of real gases. The ideal gas law relates the state of a certain amount of gas to its pressure, volume, and temperature, according to the equation:
pV = nRT
where
p = pressure [Pa]
V = volume of the gas [m3]
n = amount of gas [mol]
R = universal gas constant (= 8.3145 J/mol K)
T = temperature [K]
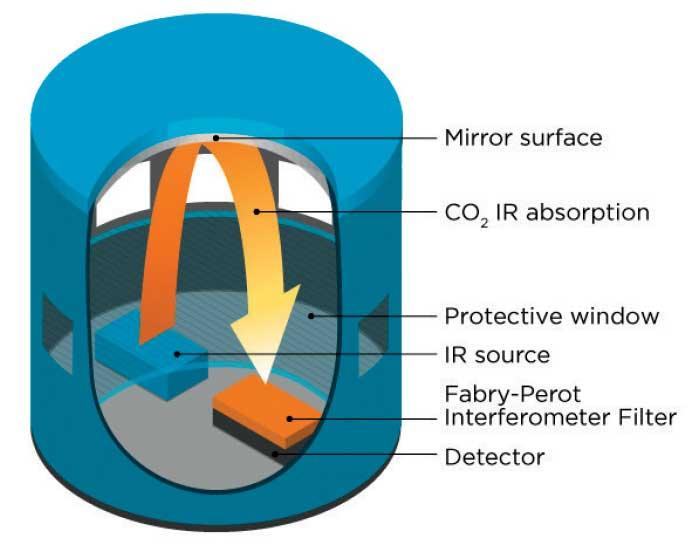
Figure 2. The structure of the Vaisala CARBOCAP® CO2 sensor.
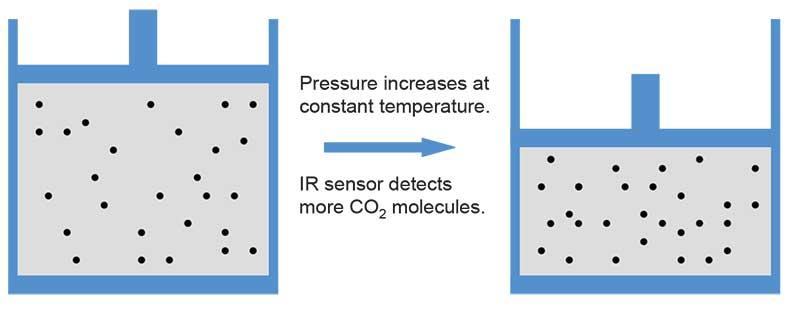
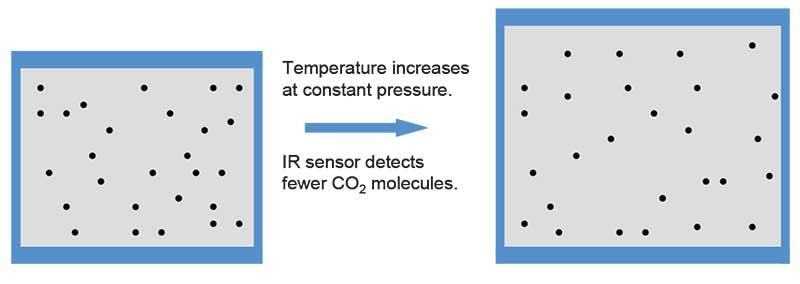
Most gas sensors give out a signal proportional to the molecular density (molecules/volume of gas), even though the reading is expressed in parts per million (volume/volume). As the pressure and/or temperature changes, the molecular density of the gas changes according to the ideal gas law. The effect is seen in the ppm reading of the sensor.
The following illustrations visualize how an increase in pressure or temperature changes the state of the gas and how it affects CO2 measurement.
The ideal gas law can be used to calculate the molecular density of a gas at a given temperature and pressure, when the gas density at Standard Ambient Temperature and Pressure (SATP) conditions is known. Replacing the amount of gas (n) with ρV/M, and assuming that the molar mass of the gas (M) is constant in the two different conditions, the equation can be written as in Equation 1.

where
ρ = gas volume concentration [ppm or %]
p = ambient pressure [hPa]
t = ambient temperature [°C]
Equation 1. Calculation of gas concentration at given temperature and pressure.
The density formula can be used to estimate how gas sensor reading changes as temperature and/or pressure is changed.
The density formula can be used to compensate for temperature and pressure variations when measuring CO2. Typical CO2 instruments do not measure pressure and thus cannot automatically compensate for pressure variations. When calibrated at the factory, instruments are typically set to sea-level pressure conditions (1013 hPa). When measuring at altitudes other than sea-level, it is recommended to compensate for the pressure effect. This can be done either by entering the correct pressure settings for internal compensation (constant pressure conditions) or by programming the compensation into an automation system or PC (changing pressure conditions).
The same compensation rules apply to the temperature effect. However, there are more and more CO2 meters available that both measure and compensate for temperature variations, and therefore do not require any external compensation.
Table 1 shows an example of the changes in the CO2 sensor reading (gas contains 1,000 ppm of CO2 at SATP) as temperature and pressure change, according to the ideal gas law.
| Temperature (°C) | ||||||||||
| Pressure (hPa) | -20 | -10 | 0 | 10 | 20 | 25 | 30 | 40 | 50 | 60 |
| 700 | 814 | 783 | 754 | 728 | 703 | 691 | 680 | 658 | 638 | 618 |
| 800 | 930 | 895 | 862 | 832 | 803 | 790 | 777 | 752 | 729 | 707 |
| 900 | 1046 | 1007 | 970 | 936 | 904 | 888 | 874 | 846 | 820 | 795 |
| 1000 | 1163 | 1119 | 1078 | 1039 | 1004 | 987 | 971 | 940 | 911 | 883 |
| 1013 | 1178 | 1133 | 1092 | 1053 | 1017 | 1000 | 983 | 952 | 923 | 895 |
| 1100 | 1279 | 1230 | 1185 | 1143 | 1104 | 1086 | 1068 | 1034 | 1002 | 972 |
| 1200 | 1395 | 1342 | 1293 | 1247 | 1205 | 1185 | 1165 | 1128 | 1093 | 1060 |
| 1300 | 1512 | 1454 | 1401 | 1351 | 1305 | 1283 | 1262 | 1222 | 1184 | 1148 |
Table 1. The ppm reading of a CO2 sensor when measuring a gas with 1,000 ppm concentration
under different temperature and pressure conditions.
Processing the ideal gas law further provides a way of understanding what happens when the composition of a gas mixture is varied at a constant pressure, temperature, and volume. This can be used, for example, to estimate the effect of changing humidity on the CO2 reading.
The molecules of a gas mixture exist in the same system volume (V is the same for all gases) at the same temperature. The ideal gas law can be modified to:

where
ngas1 = amount of gas 1 [mol]
ngas2 = amount of gas 2 [mol], etc.
and

where
p = total pressure of the gas mixture
pgas1 = partial pressure of gas 1
pgas2 = partial pressure of gas 2, etc.
The second equation is called Dalton's Law of Partial Pressure. It states that the total pressure of a gas mixture is the sum of the partial pressures of all the component gases in the mixture.
This information is useful when taking into account the influence of water vapor on CO2 sensor readings. When water vapor is added to a dry gas at constant pressure, temperature, and volume, water replaces some of the gas molecules in the mixture. Similarly, when a gas sample is drawn from a high-humidity environment and is allowed to dry before entering the measurement chamber of a CO2 meter, the loss of water molecules changes the composition of the gas and has an effect on the CO2 measurement.
This so-called dilution effect can be estimated using Table 2. The CO2 concentration of the high-humidity environment can be calculated when the CO2 concentration of the dried gas is known. In order to do this, the dew point (Td at 1013 hPa) or water concentration (ppm) of the wet and dry conditions need to be known. The humidity condition of the high-humidity environment is chosen from the horizontal axis and the condition of the dried gas from the vertical axis.
Example: A gas sample is drawn from an environment with a dew point of 40°C (73,000 ppm of water) to an environment of 20°C Td (23,200 ppm of water). The measured CO2 concentration of 5.263% at 20°C Td translates to 5.00% in the 40°C Td environment (5.263% × 0.950 = 5.00%). The lower reading is caused by dilution resulting from the higher water content at 40°C Td.
| Td(°C) | -40 | -30 | -20 | -10 | 0 | 10 | 20 | 30 | 40 | 50 | 60 | |
| Td(°C) | ppm H2O | 127 | 377 | 1 020 | 2 580 | 6 060 | 12 200 | 23 200 | 42 000 | 73 000 | 122 000 | 197 000 |
| -60 | 11 | 0.9999 | 0.9996 | 0.999 | 0.997 | 0.994 | 0.988 | 0.977 | 0.958 | 0.927 | 0.878 | 0.803 |
| -50 | 39 | 0.9999 | 0.9997 | 0.999 | 0.997 | 0.994 | 0.988 | 0.977 | 0.958 | 0.927 | 0.878 | 0.803 |
| -40 | 127 | 1.0000 | 0.9997 | 0.999 | 0.998 | 0.994 | 0.988 | 0.977 | 0.958 | 0.927 | 0.878 | 0.803 |
| -30 | 377 | 1.0000 | 0.999 | 0.998 | 0.994 | 0.988 | 0.977 | 0.958 | 0.927 | 0.878 | 0.803 | |
| -20 | 1 020 | 1.000 | 0.998 | 0.995 | 0.989 | 0.978 | 0.959 | 0.928 | 0.879 | 0.804 | ||
| -10 | 2 580 | 1.000 | 0.997 | 0.990 | 0.979 | 0.961 | 0.930 | 0.880 | 0.805 | |||
| 0 | 6 050 | 1.000 | 0.994 | 0.983 | 0.964 | 0.933 | 0.884 | 0.809 | ||||
| 10 | 12 200 | 1.000 | 0.989 | 0.970 | 0.939 | 0.890 | 0.815 | |||||
| 20 | 23 200 | 1.000 | 0.981 | 0.950 | 0.901 | 0.826 | ||||||
| 30 | 42 000 | 1.000 | 0.969 | 0.920 | 0.845 | |||||||
| 40 | 73 000 | 1.000 | 0.951 | 0.876 | ||||||||
| 50 | 122 000 | 1.000 | 0.925 | |||||||||
| 60 | 197 000 | 1.000 |
Table 2. Dilution coefficients in gas sample drying.
Effect of Different Levels of CO2 | |
| CONCENTRATION | EFFECT |
| 350 - 450 ppm | Typical atmospheric concentration |
| 600 - 800 ppm | Acceptable indoor air quality |
| 1,000 ppm | Tolerable indoor air quality |
| 5,000 ppm | Average exposure limit over 8-hour period |
| 6,000 - 30,000 ppm | Concern, short exposure only |
| 3 - 8% | Increased respiration rate, headache |
| > 10% | Nausea, vomiting, unconsciousness |
| > 20% | Rapid unconsciousness, death |
Carbon dioxide is a non-toxic and non-flammable gas. However, exposure to elevated concentrations can induce a risk to life. Whenever CO2 gas or dry ice is used, produced, shipped, or stored, CO2 concentration can rise to dangerously high levels. Because CO2 is odorless and colorless, leakages are impossible to detect, meaning proper sensors are needed to help ensure the safety of personnel.
±1.7%RH wall transmitters with a certificate for demanding HVAC
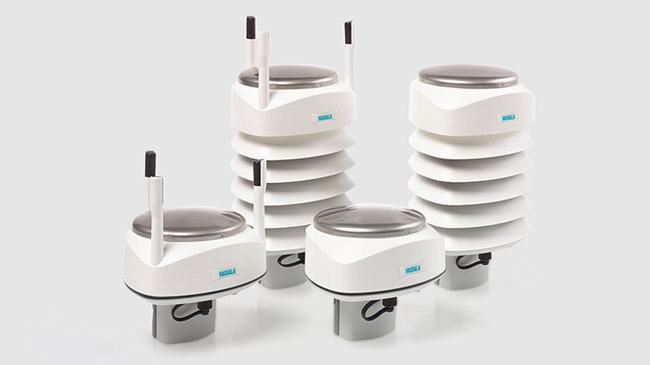
Vaisala Weather Transmitter WXT530 series is a unique collection of cost-effective sensors that accurately and reliably measure weather conditions…
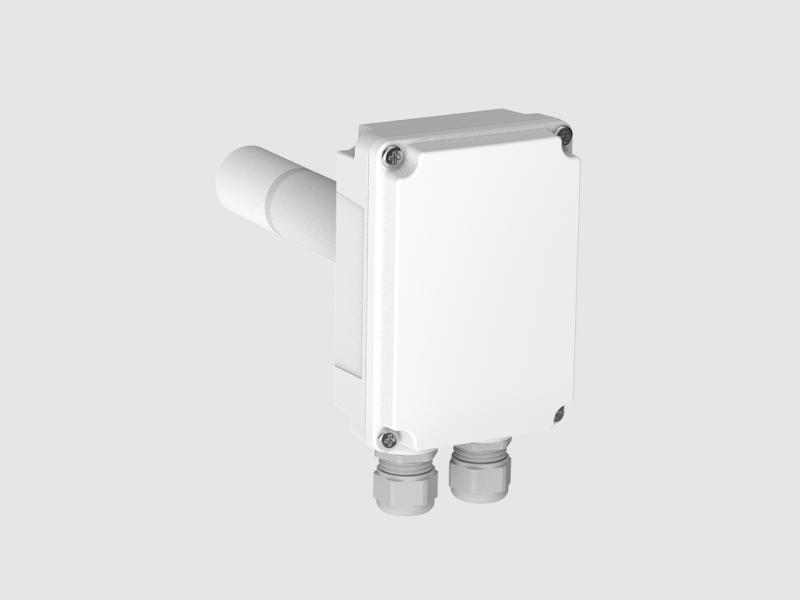
For high-accuracy measurements in HVAC applications
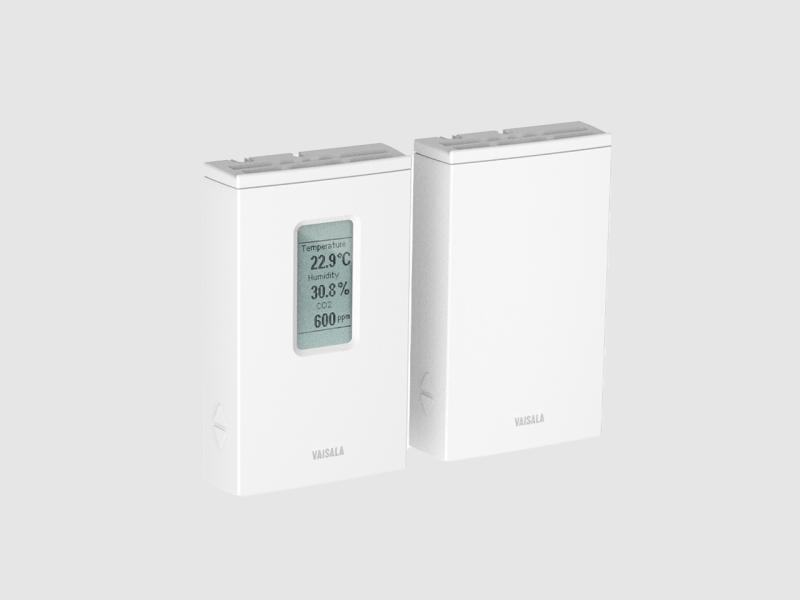
for green building projects
for green building projects
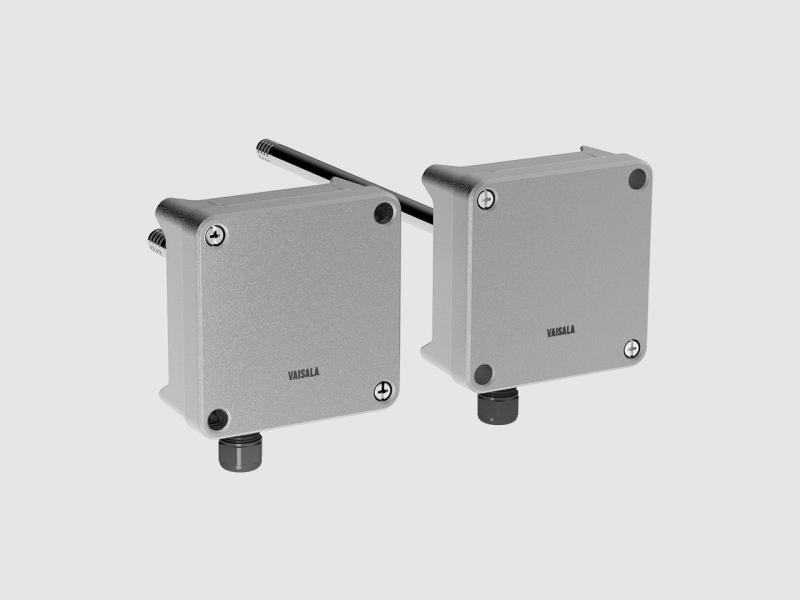
For high precision measurements in demanding HVAC applications

How infrared sensors work, temperature/pressure/humidity compensation, and transmitter placement.
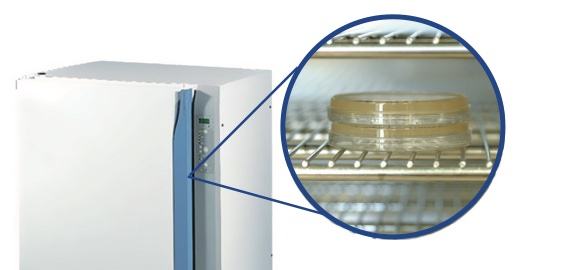
Why CO2 is critical in cell culture, the risk of condensation when measuring in high humidity and temperature, and why sterilization without removing…
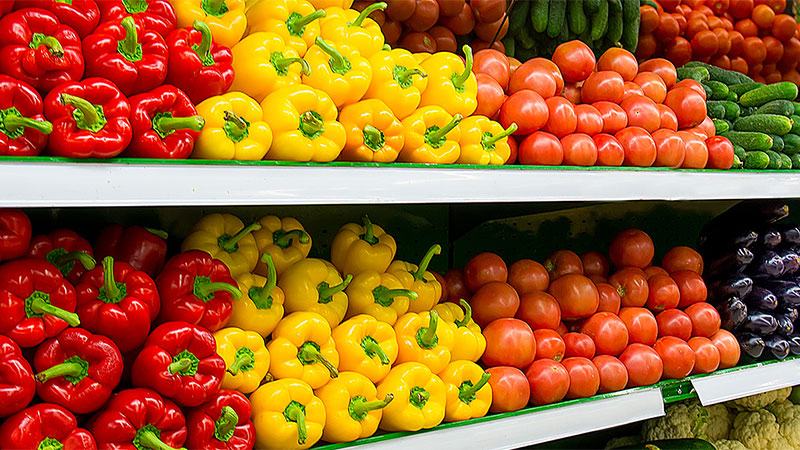
Why O2 is lowered and CO2 raised in controlled-atmosphere rooms, and which instruments withstand the cold and high humidity of this environment.

What equilibrium sampling is, why sensor heating can skew field measurements, and what range is needed for deep soil profiles.
A specialist replies with the solution, the instrument and the service that fit.
Instruments to quote
No instruments yet. An enquiry can be sent anyway: a specialist answers.