

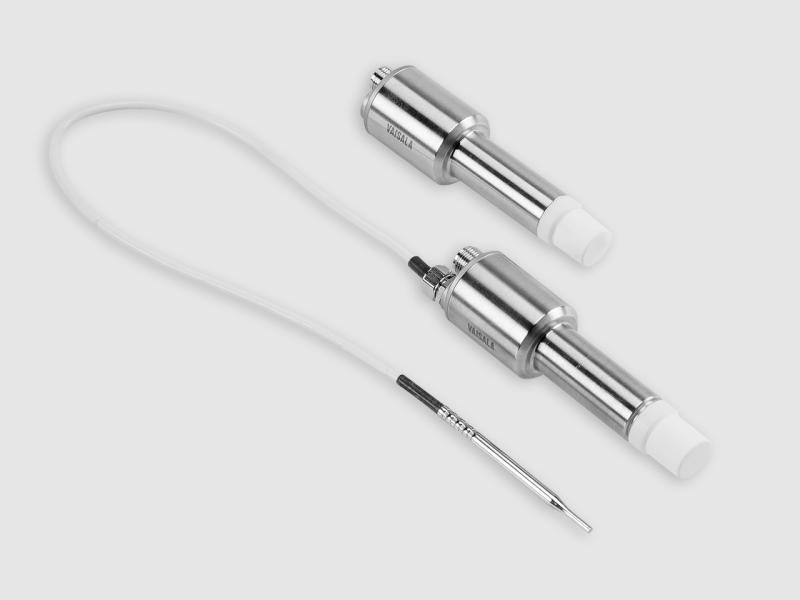
Vaporized Hydrogen Peroxide, Humidity and Temperature Measurement HPP270 Series
for bio-decontamination processes
Application note
In bio-decontamination applications that use vaporized hydrogen peroxide (VH2O2) the condensation point can be a useful parameter. However, when H2O2 vapor is present in the air, deriving the dew point from only the water vapor is insufficient because the H2O2 vapor will change the dew point.
In bio-decontamination applications that use vaporized hydrogen peroxide (VH2O2) the condensation point can be a useful parameter. However, when H2O2 vapor is present in the air, deriving the dew point from only the water vapor is insufficient because the H2O2 vapor will change the dew point.
Dew point can never be higher than ambient temperature. If the dew point equals ambient temperature, condensation occurs. This is the point where relative saturation equals 100 %.
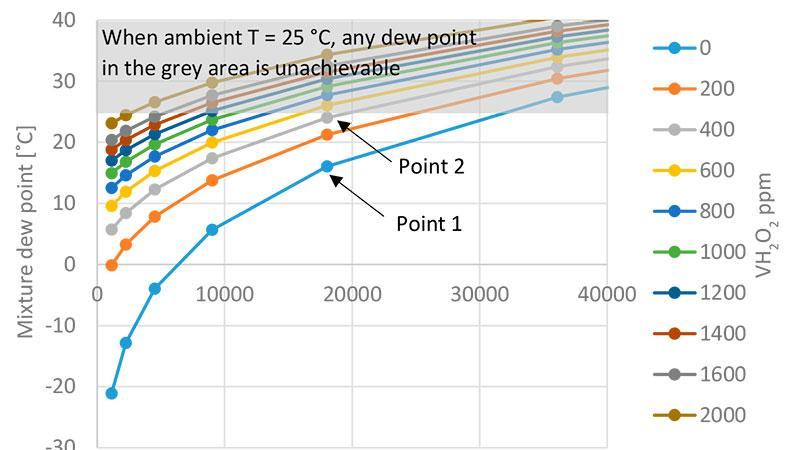
In Figure 1, we see that dew point temperatures over 25 °C in the grey area cannot be achieved if the ambient temperature is 25 °C. Where H2O2 vapor concentration is 0 ppm (point 1) and 400 ppm (point 2) and the temperature is 25 °C, the water vapor concentration is 18,040 ppm. At point 1, the mixture dew point is 16.1 °C and relative humidity and relative saturation are the same 57.7 %RH. At point 2, where the H2O2 concentration is 400 ppm, the mixture dew point is 24.0 °C. Relative humidity remains unchanged at 57.7 %RH and relative saturation rises to 91.5 %RS. We see that by adding 400 ppm of H2O2 vapor, the mixture dew point increases by 7.9 °C, relative saturation by 33.8 %RS, and the air mixture is brought closer to condensation.
Water vapor concentration [ppmv]
Figure 1. Both H2O2 vapor and water vapor affect the mixture dew point. The lines represent different vaporized H2O2 concentrations and the X-axis shows different water vapor concentrations. The higher the H2O2 vapor concentration, the higher the mixture dew point is, although the water vapor concentration remains the same.
Dew point is highly linked to condensation and can be used to detect when condensation will occur. In Figure 2, we see the maximum achievable vaporized H2O2 concentration when the vapor is produced with 35 % and 59 % H2O2 liquid. At every single point along the trend lines, relative saturation is 100 %RS, and mixture dew point equals ambient temperature on the X-axis.
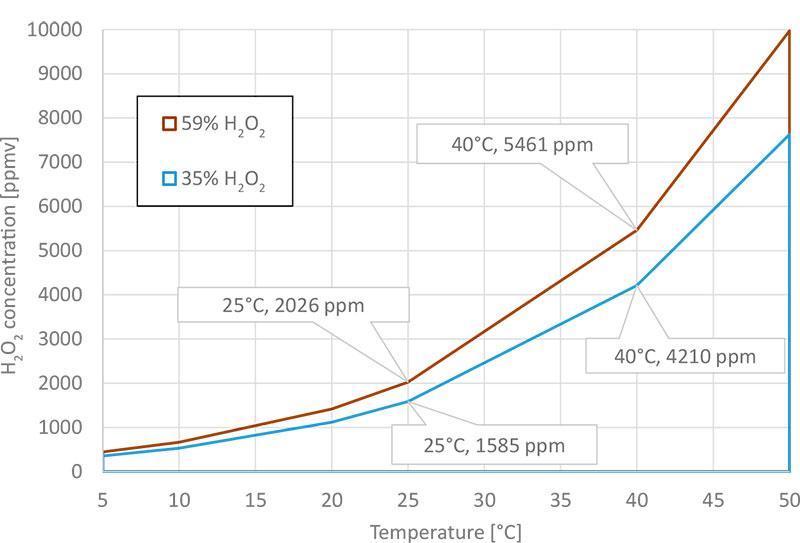
Figure 2. The maximum achievable vaporized H2O2 concentration in air when the vapor is produced by vaporizing 35% and 59% H2O2 liquid. The maximum achievable H2O2 concentration is highly dependent on ambient temperature.
H2O2 liquid used to produce H2O2 vapor in bio-decontamination applications typically comes as a mixture of water and H2O2. For example, 35 % of the liquid’s weight is H2O2 and 65 % of its weight is water. When this aqueous solution is vaporized, both H2O and H2O2 vapor concentrations will increase. Both vapors will affect the mixture dew point. Once condensation occurs, neither the concentration of H2O2 or H2O can be increased. Higher concentration vapors can only be achieved by decreasing the liquid’s water content, or by increasing the air temperature. The increase of temperature will increase the gap between mixture dew point and ambient temperature.
Unlike relative humidity or relative saturation, measured mixture dew point is independent of temperature. If temperature is not uniform within the chamber, dew point can be a helpful measurement.
Relative saturation is a good parameter to detect condensation. However, because RS is temperature dependent, probe placement can be critical. When monitoring condensation using mixture dew point, the measurement probe can be placed more freely. Note that the dew point value is the same at every measurement point in Figure 3.
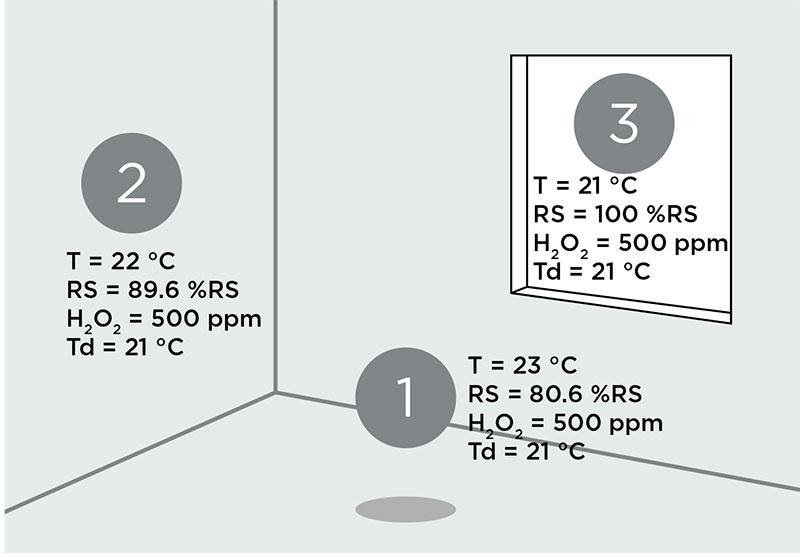
Figure 3. The chamber has an evenly distributed air and vapor mixture, but there are temperature differences between the three measurement points. Condensation will occur first where the temperature is coldest. Td represents both water and hydrogen peroxide vapor mixture dew point.
Temperature variability can serve as a guide to choosing the parameter to monitor: relative saturation or dew point. Success in measuring H2O and H2O2 vapors starts with understanding the measurement values and the conditions of your application. With this knowledge, you can choose the best parameter to monitor during vaporized hydrogen peroxide biodecontamination processes.
for bio-decontamination processes
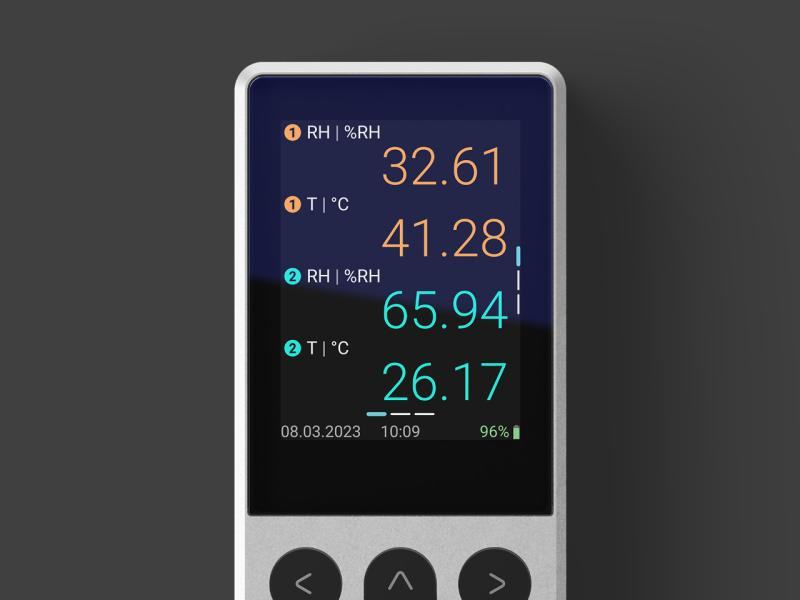
The latest addition to the Indigo family of transmitters and probes, the Indigo80 is a compact, handheld indicator and data logger. Ideal for field…
for refrigerant dryers
for OEM applications
for quick inspections and spot-checking
For high precision measurements in demanding HVAC applications

How infrared sensors work, temperature/pressure/humidity compensation, and transmitter placement.
Why CO2 is critical in cell culture, the risk of condensation when measuring in high humidity and temperature, and why sterilization without removing…

Why O2 is lowered and CO2 raised in controlled-atmosphere rooms, and which instruments withstand the cold and high humidity of this environment.

What equilibrium sampling is, why sensor heating can skew field measurements, and what range is needed for deep soil profiles.
A specialist replies with the solution, the instrument and the service that fit.
Instruments to quote
No instruments yet. An enquiry can be sent anyway: a specialist answers.