

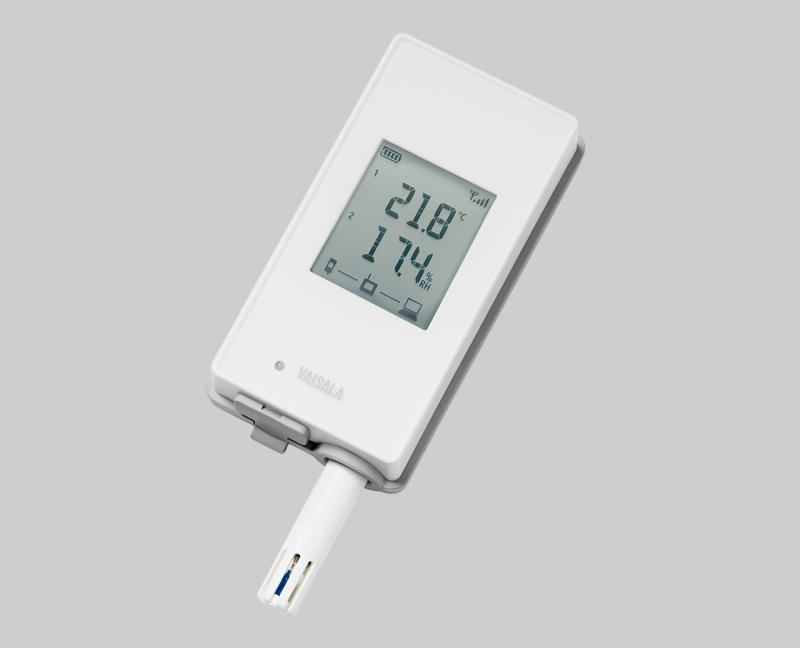
VaiNet wireless data logger RFL100
For wireless monitoring of controlled areas
Technical note
Temperature mapping is a crucial process for maintaining GxP compliance, product quality, and regulatory adherence in temperature-sensitive environments. Seasonal variations—whether extreme heat in summer or cold in winter—can impact storage conditions, making it essential to conduct seasonal temperature mapping to identify potential risks and ensure consistent environmental control.
This checklist provides a step-by-step approach to help you plan, execute, and analyze temperature mapping effectively. By following these best practices, you can ensure accurate data collection, regulatory compliance, and optimal environmental conditions year-round.
☑ Ensure compliance with GxP guidelines.
☑ Review any updates to regulations or internal SOPs.
2. Define Objectives
☑ Identify the purpose of the thermal mapping (e.g., validation, monitoring).
☑ Determine the specific areas and equipment to be mapped.
3. Develop a Protocol
☑ Create a detailed thermal mapping protocol.
☑ Include scope, methodology, acceptance criteria, reporting requirements.
4. Select Equipment
☑ Choose calibrated data loggers and sensors.
☑ Verify calibration certificates are up-to-date.
5. Plan the Mapping Schedule
☑ Schedule mapping during peak seasonal conditions (summer/winter).
☑ Coordinate with relevant departments to minimize disruptions.
6 .Install Data Loggers
☑ Place data loggers in critical areas (e.g., storage, processing zones).
☑ Ensure even distribution and proper placement according to the protocol.
7. Conduct Pre-Mapping Checks
☑ Verify all equipment is functioning correctly.
☑ Document initial conditions and any deviations.
8. Monitor and Record Data
☑ Start data logging according to the protocol.
☑ Ensure continuous monitoring throughout the mapping period.
9. Environmental Controls
☑ Maintain consistent environmental conditions.
☑ Record any changes or interventions during the mapping period.
10. Retrieve Data Loggers
☑ Carefully collect all data loggers.
☑ Ensure no data is lost or corrupted.
11. Analyze Data
☑ Review and analyze the collected data.
☑ Identify any temperature excursions or trends.
☑ Address any identified issues or deviations.
12. Report Findings
☑ Compile a comprehensive report.
☑ Include data analysis, graphs, and any deviations from the protocol.
13. Review and Approve
☑ Submit the report for review by relevant stakeholders.
☑ Obtain necessary approvals and sign-offs.
For more detailed information on these steps, please see our white paper: Better Warehouse Mapping
In this on-demand webinar, you will learn from a seasoned expert with 20+ years of experience.
✔ Regulatory insights – Global compliance demystified
✔ Best practices – Sensor placement, common pitfalls & troubleshooting
✔ Actionable guidance – Tips from real-world temperature mapping
Watch now
For wireless monitoring of controlled areas
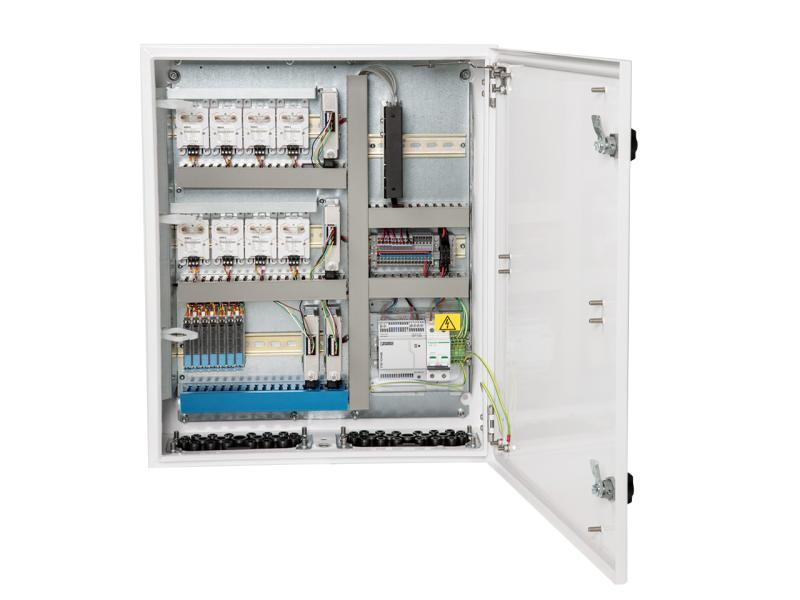
for cleanrooms and industrial settings
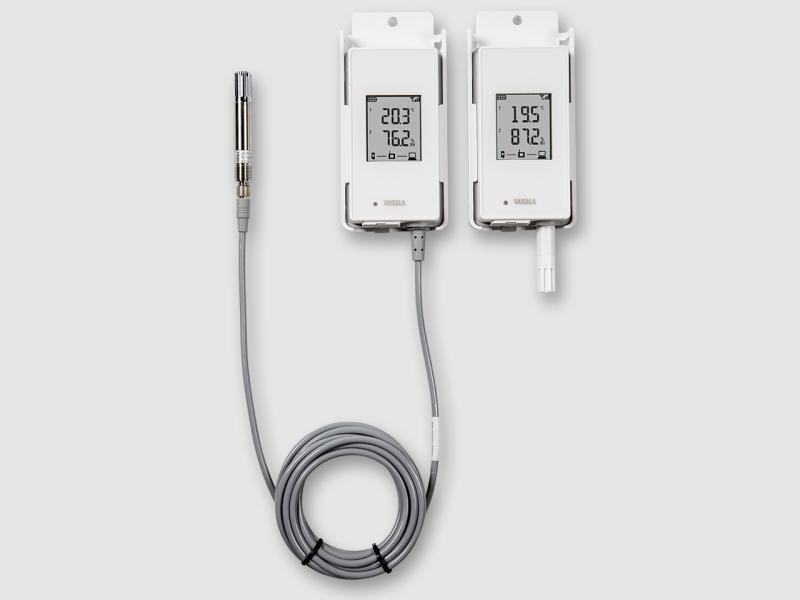
for monitoring humidity and temperature
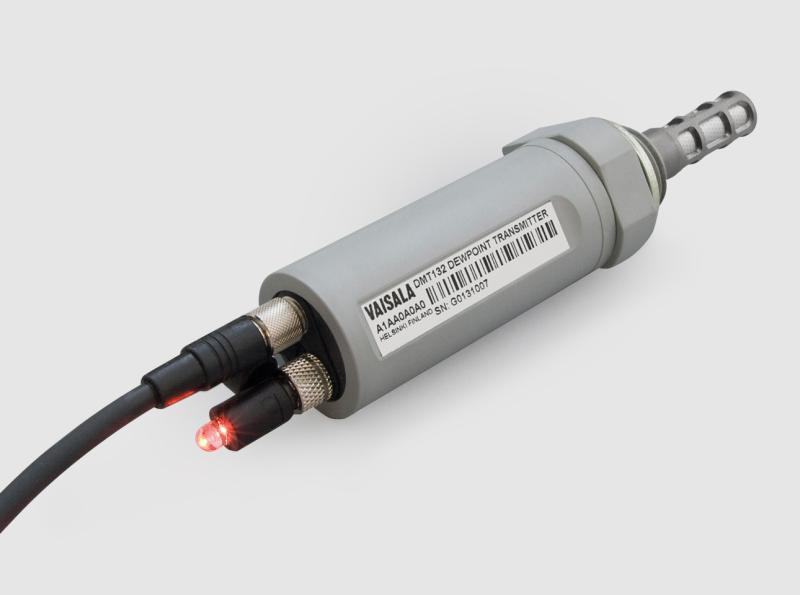
for refrigerant dryers
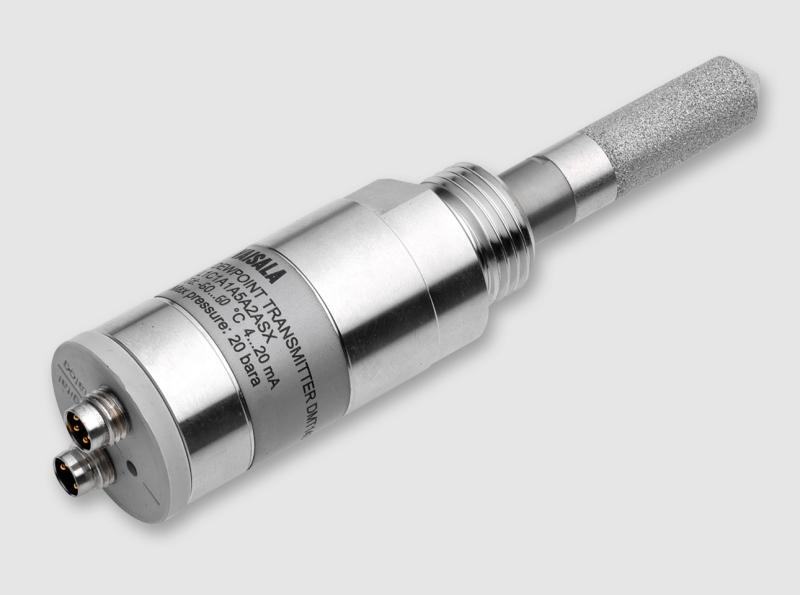
for OEM applications
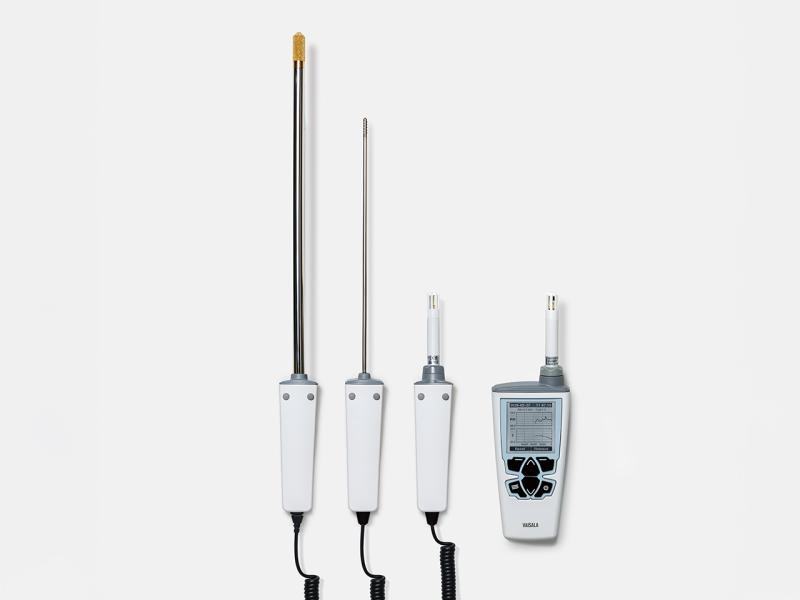
for quick inspections and spot-checking
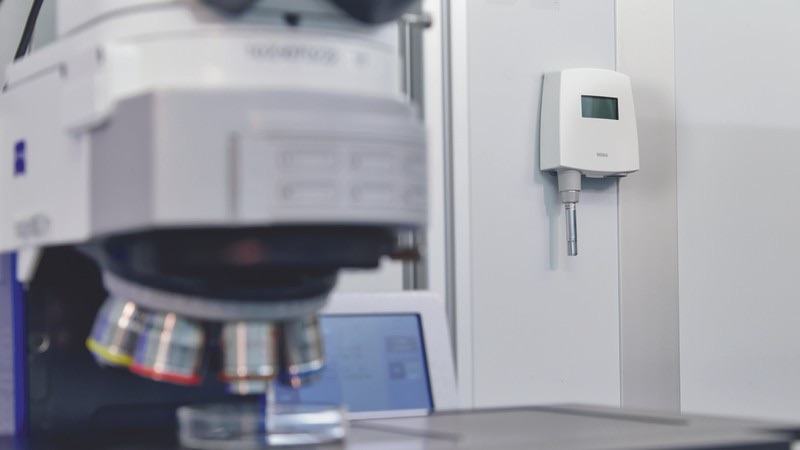
What relative humidity, dew point, absolute humidity and mixing ratio are, how temperature and pressure distort the reading, and why dew point is…
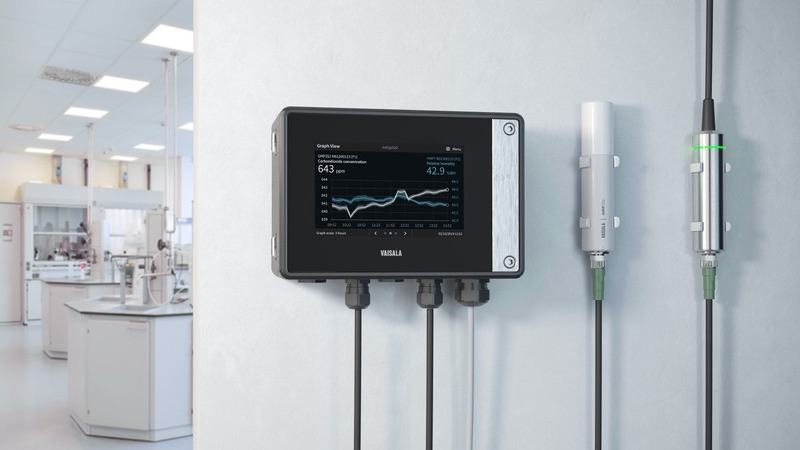
How humidity behaves in real conditions, the three most common measurement problems, and two practical scenarios —heated air and compressed air—…
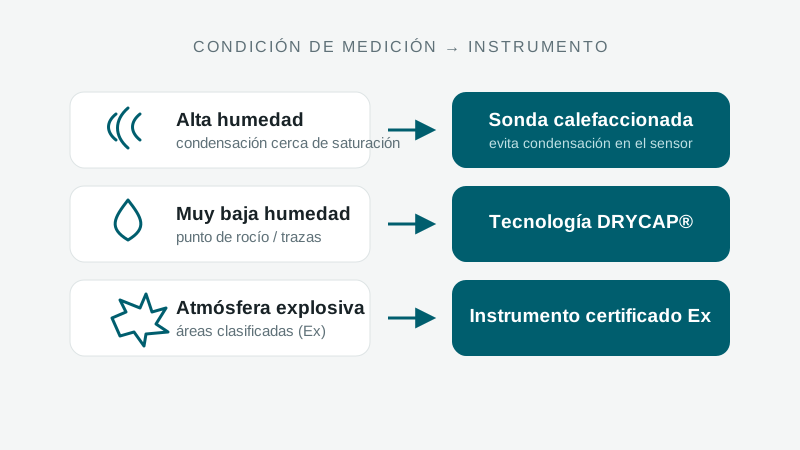
When to measure relative humidity vs. dew point, what high and low humidity demand, how temperature and pressure factor in, and when a warmed probe…

Cooling accounts for up to 40% of a data center's energy demand. This Vaisala guide explains how measurement accuracy cuts costs and risks, with a…
A specialist replies with the solution, the instrument and the service that fit.
Instruments to quote
No instruments yet. An enquiry can be sent anyway: a specialist answers.