

How to Measure Carbon Dioxide (CO₂)
How infrared sensors work, temperature/pressure/humidity compensation, and transmitter placement.
Application note
Mapping and monitoring are very similar processes: in both, environmental data is collected at regular intervals from field-deployed data loggers. The difference is that in continuous monitoring the devices stay fixed in one location, while in a mapping qualification they are deployed for short periods in locations that change from study to study.
Because of that similarity, temperature mapping qualifications can be performed with the same monitoring software — avoiding dedicated data acquisition equipment, thermocouples, and less robust data loggers.
With wireless data loggers connected through Vaisala's VaiNet technology — over 100 meters of indoor range, even in complex manufacturing environments — mapping data can be viewed in real time, from a freezer room to a large ambient warehouse. Because the software is a monitoring system, it can instantly notify you if the data fails to meet acceptance criteria: never again collect your loggers at the end of a study only to learn that it failed.
Live data also lets you detect when the space has reached thermal equilibrium before formally starting the study. And if the connection is interrupted, each logger keeps 30 days of data locally; on reconnection, the software downloads it automatically through the backfill process.
The RFL-series wireless data loggers use smart probes: independent measurement devices that store their calibration data in on-board memory and perform A/D conversion locally. The practical consequence is that only the probe needs calibration, not the logger.
After a study, the probes are removed for post-study calibration verification, and the logger body receives a calibrated probe to be deployed immediately in the next study — the units never go out of service. With a fixed 1-minute sample rate, NTP synchronization, an 18-month battery life on standard AA cells, and ranges down to −196 °C with a remote probe, the same fleet covers everything from ultra-low temperature freezers to entire warehouses.
The viewLinc procedure is brief: install and validate the software with its IQOQ protocol (once), register the data loggers (once), create virtual “Locations” for each study point and link them to the loggers, define acceptance criteria with a threshold alarm template, deploy, verify equilibrium, run the study, and generate the alarm history and location history reports.
Two rules are inflexible. First: acceptance criteria must be set before the study is performed — the software does not allow alarm thresholds to be created retroactively. Second: two reports are needed for complete evidence — the alarm history identifies excursions that violated the criteria, and the location history provides raw and statistical data with maximums and minimums per point. For advanced analysis, data can be exported to a spreadsheet.
This technical content is based on Vaisala's application note on temperature mapping with the viewLinc system. AKRIBIS is an authorized Vaisala partner for distribution and technical support in the region — explore the full Vaisala instrumentation line. To design the mapping study for your chamber or warehouse, consult a specialist.
How infrared sensors work, temperature/pressure/humidity compensation, and transmitter placement.
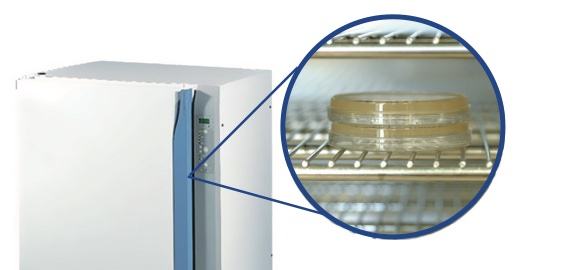
Why CO2 is critical in cell culture, the risk of condensation when measuring in high humidity and temperature, and why sterilization without removing…

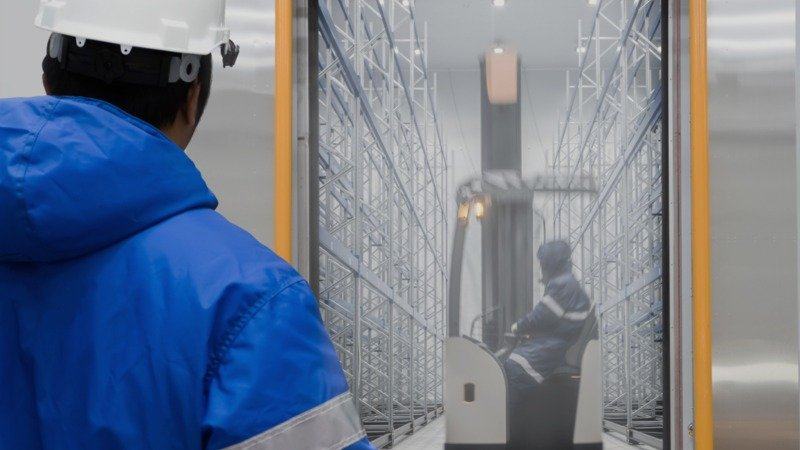
Why O2 is lowered and CO2 raised in controlled-atmosphere rooms, and which instruments withstand the cold and high humidity of this environment.
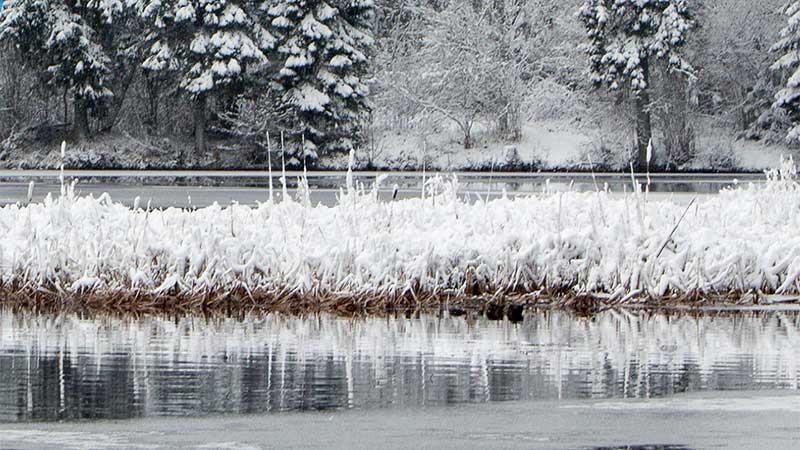
What equilibrium sampling is, why sensor heating can skew field measurements, and what range is needed for deep soil profiles.
A specialist replies with the solution, the instrument and the service that fit.
Instruments to quote
No instruments yet. An enquiry can be sent anyway: a specialist answers.